  |
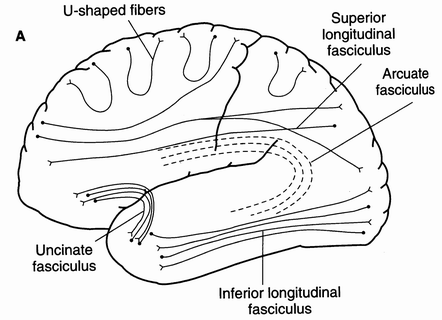
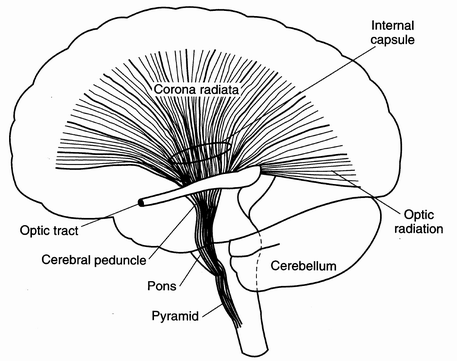
Figure 7: Brain structures: Corona radiata. The diagram on the left is from [18]. On the right the fibers are reconstructed from DT-MRI data using our oriented tensor reconstruction (OTR) algorithm. The corona radiata is visible in both hemispheres.
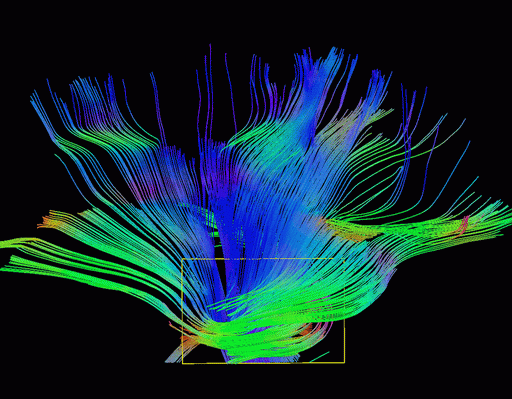
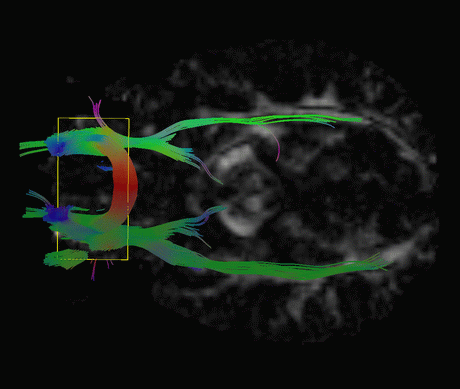
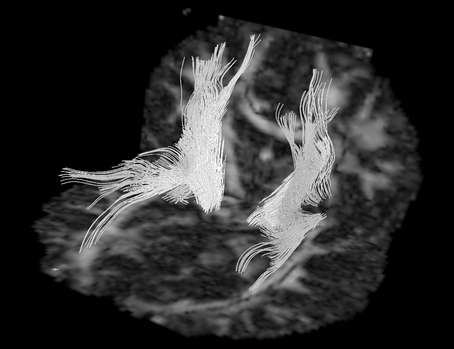
Figure 8: Right hemisphere corona radiata shown from opposite directions. The yellow boxes show the seed region for the OTR fiber tracing algorithm. Color coding indicates orthogonal directions in the amount of RGB (XYZ).
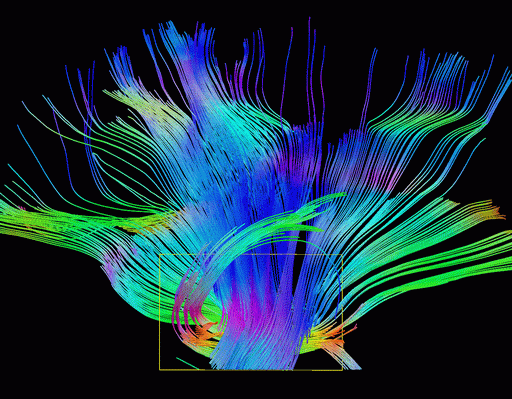
Figure 9: Brain structures: U-shaped fibers, parts of corona radiata and corpus callosum. The diagram on the left is from [18]. Note the short U-shaped fibers in the left upper part of the right image. Color coding is the same as the previous figure.
Figure 10: Brain structures: Fibers near the cortical surface and U-shaped fibers on the left; optic tract on the right.
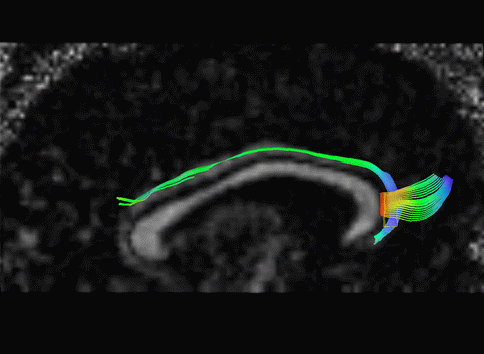
Figure 11:
Brain structures: on the left is a side view of the right hemisphere
cingulum bundle on the background of corresponding
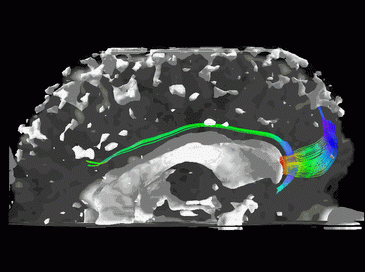
![]() anisotropy; on the right the same structure together with 3d models of the ventricle and CSF (cerebrospinal fluid) extracted by isosurfacing [13] on isotropic part
anisotropy; on the right the same structure together with 3d models of the ventricle and CSF (cerebrospinal fluid) extracted by isosurfacing [13] on isotropic part
![]() (see Eq. (6)) of the same DT-MRI dataset.
(see Eq. (6)) of the same DT-MRI dataset.
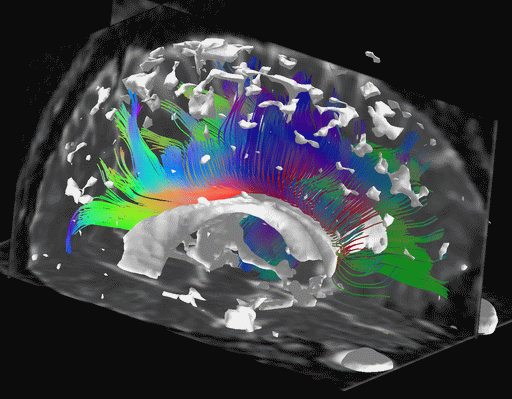
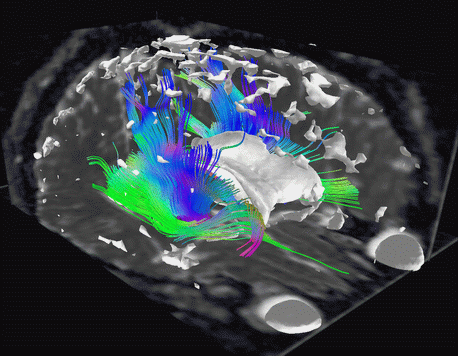
Figure 12:
Brain structures: corpus callosum (left) and corona radiata (right) shown
together with isotropic brain structures - ventricle, eye sockets and pockets of CSF on the top of the brain. Cutting planes show isotropic
![]() values.
values.